Information. Insights. Intelligence.
Information
Centralize essential data in a single, comprehensive academic intelligence dashboard. From admission scores to test performance and shelf exam results, ei3 provides a seamless, all-in-one solution for managing and analyzing critical academic metrics.
Insights
Data is only valuable when it’s easily accessible. The true power of ei3 lies in its ability to unify a diverse range of data, presenting it in an intuitive and visually compelling way. This empowers programs to unlock insights from already collected data, enabling deeper discovery and more informed decision-making.
Intelligence
ei3 dives deep into student data, providing the insight needed to evaluate student performance and drive meaningful change. This allows the focus to stay on what truly matters—making informed decisions and fostering continuous improvement.
Features
360° Overview
General Information
Access a student’s key information, including cohort, date of birth, matriculation year, expected graduation year, and enrollment details, all in one streamlined page.
Customizable
ei3 is designed to be fully customizable, tailored to meet the unique needs of any program.
National Exams
Store and analyze results from national examinations, such as the MCAT and COMAT, with the ability to view data at both the individual student and cohort level.
Didactic Analysis
Clinical Analysis
Quickly access the dates, rotations, preceptors, and clinical sites assigned to a student during their clerkship, along with evaluations completed by both preceptors and students.
Evaluation Analysis
Attendance
Track and analyze a student’s attendance, including the percentage and total days attended, as well as the breakdown of excused and unexcused absences and tardies.
Academic History
Get a comprehensive view of a student’s academic history by tracking key details such as institution, degree, GPA, class rank, and more.
Student Notes
Leave comments on a student’s profile using a thread-based format, enabling replies and creating organized chains of conversation for seamless communication.
Mobile-Friendly
Data Import
Our user-friendly Data Import interface makes it easy to upload student information for a selected data type, cohort, grade level, and any preadmission information such as exam scores and GPAs.
Features
360° Overview
Gain comprehensive insights into your program’s performance across courses, rotations, evaluations, and national examinations through engaging, data-driven visualizations.
General Information
Access a student’s key information, including cohort, date of birth, matriculation year, expected graduation year, and enrollment details, all in one streamlined page.
Customizable
As with all our products, ei3 is designed to be fully customizable, tailored to meet the unique needs of your program.
National Exams
Store and analyze results from national examinations, such as the MCAT and COMAT, with the ability to view data at both the individual student and cohort level.
Didactic Analysis
Compare a student’s grades to the class average across their enrolled courses. Effortlessly access detailed breakdowns of assignment and exam scores with a single click.
Clinical Analysis
Quickly access the dates, rotations, preceptors, and clinical sites assigned to a student during their clerkship, along with evaluations completed by both preceptors and students.
Evaluation Analysis
ei3’s evaluation interface offers in-depth reporting on evaluations completed both about and by a student, providing comprehensive insights into performance and feedback.
Attendance
Track and analyze a student’s attendance, including the percentage and total days attended, as well as the breakdown of excused and unexcused absences and tardies.
Data Import
Our user-friendly Data Import interface makes it easy to upload student information for a selected data type, cohort, grade level, and any preadmission information such as exam scores and GPAs.
Academic History
Get a comprehensive view of a student’s academic history by tracking key details such as institution, degree, GPA, class rank, and more.
Student Notes
Leave comments on a student’s profile using a thread-based format, enabling replies and creating organized chains of conversation for seamless communication.
Mobile-Friendly
ei3 is fully optimized for seamless use across all devices—desktop, tablet, or phone—automatically adapting to any screen size for a consistent experience.
Evaluate
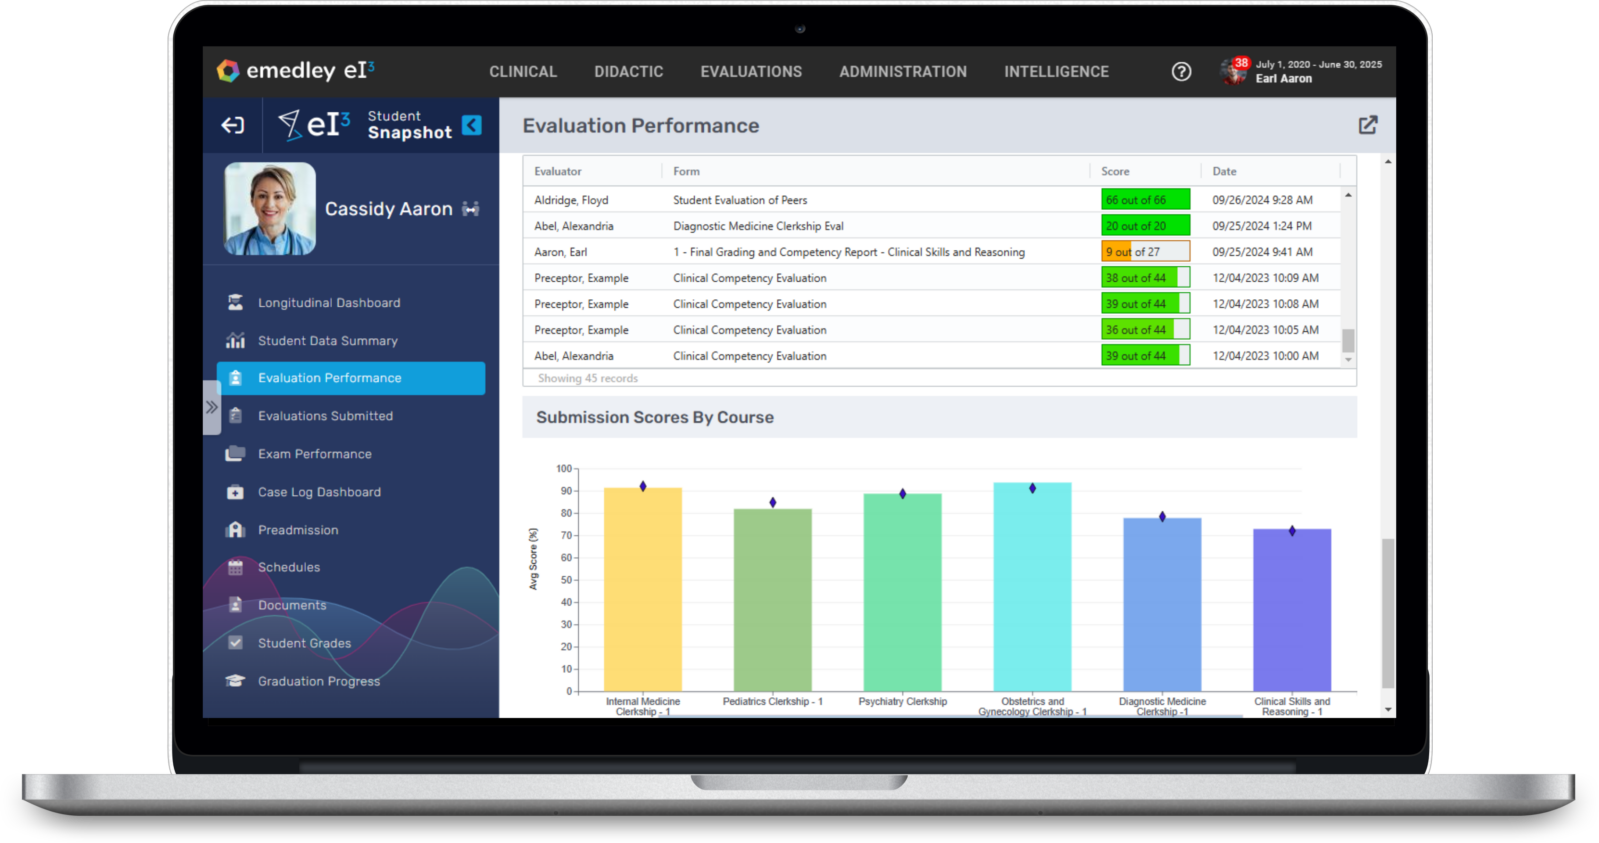
Access a detailed breakdown of student evaluation performance scores. Filter by course, preceptor, or form, enabling quick identification of areas for improvement.
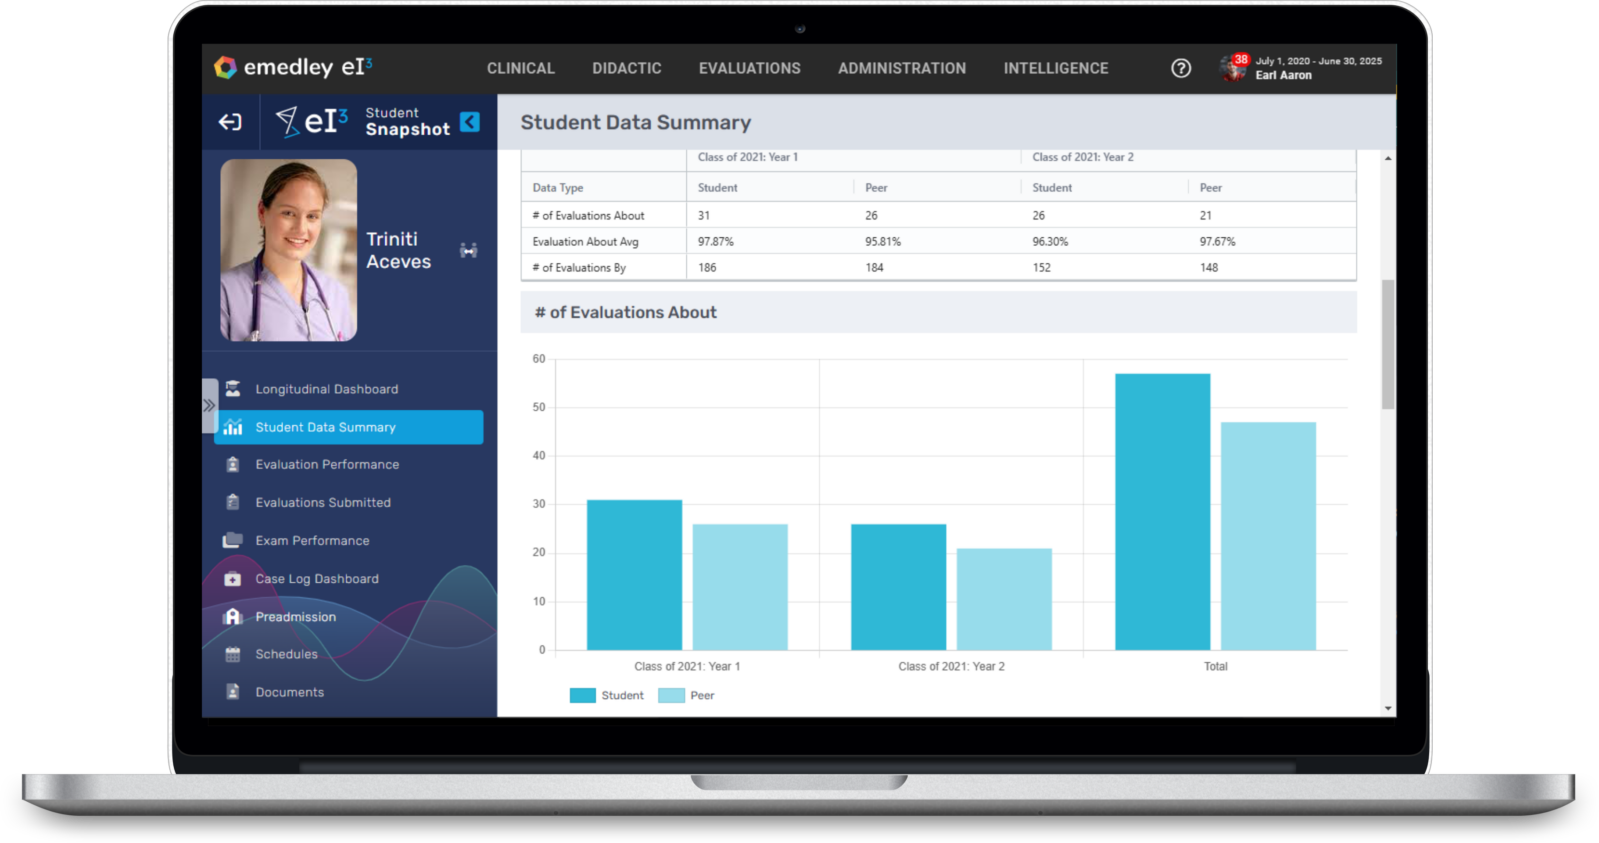
View questions, responses, and scores for each completed evaluation in a clear format, and compare question scores across all evaluations to quickly identify areas where a student needs improvement.
Evaluate

Access a detailed breakdown of student evaluation performance scores. Filter by course, preceptor, or form, enabling quick identification of areas for improvement.

View questions, responses, and scores for each completed evaluation in a clear format, and compare question scores across all evaluations to quickly identify areas where a student needs improvement.
Visualize
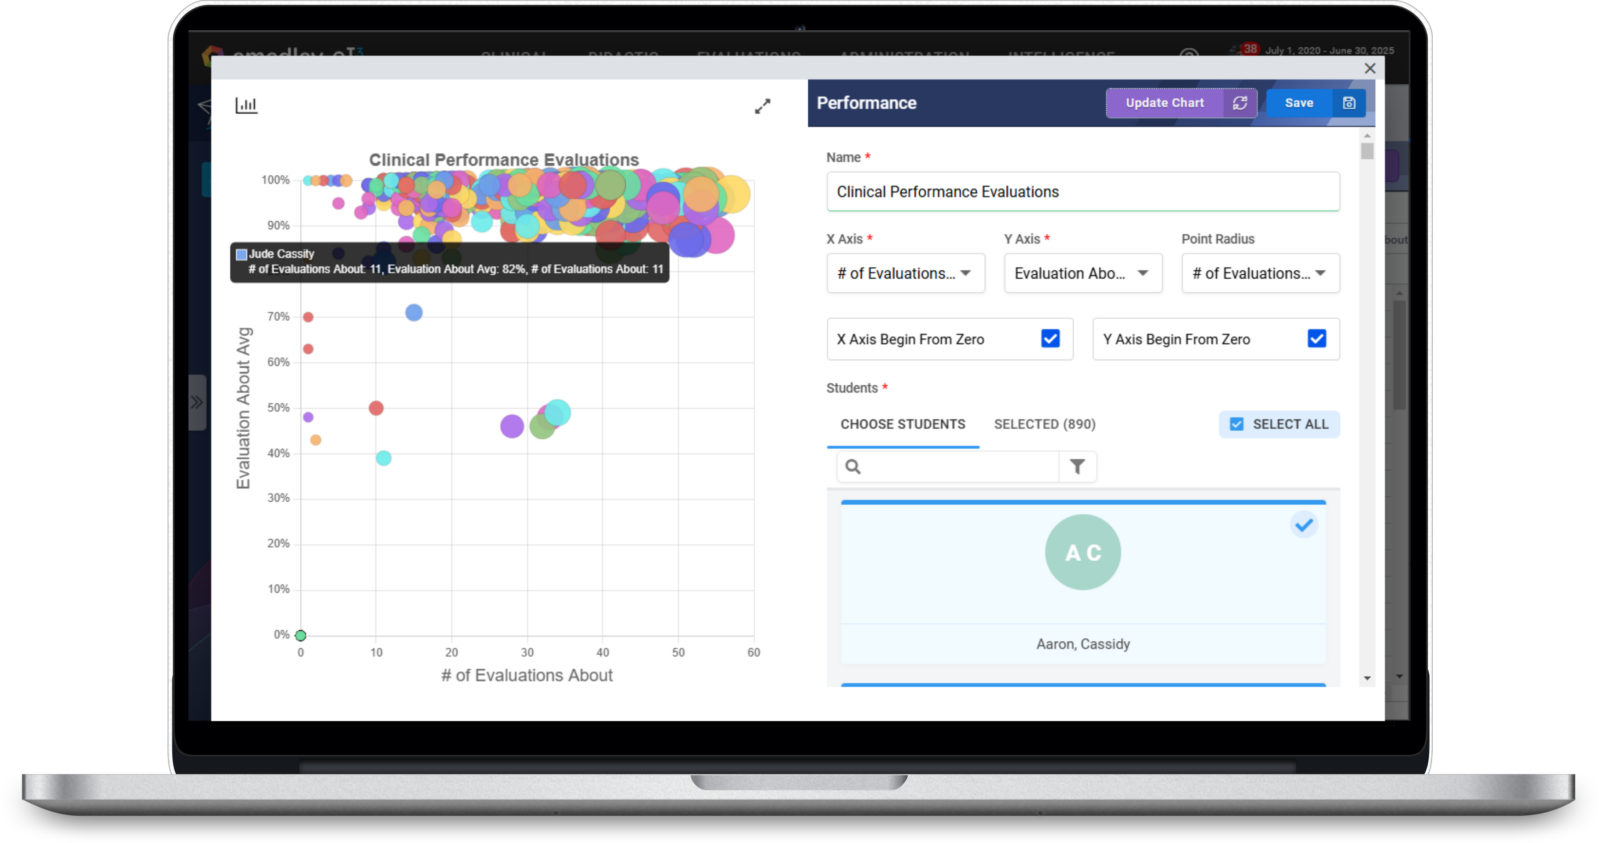
Easily analyze didactic and clinical course performance with interactive scatter plots. Access a detailed breakdown of student scores for each course, enabling quick identification of areas for improvement.
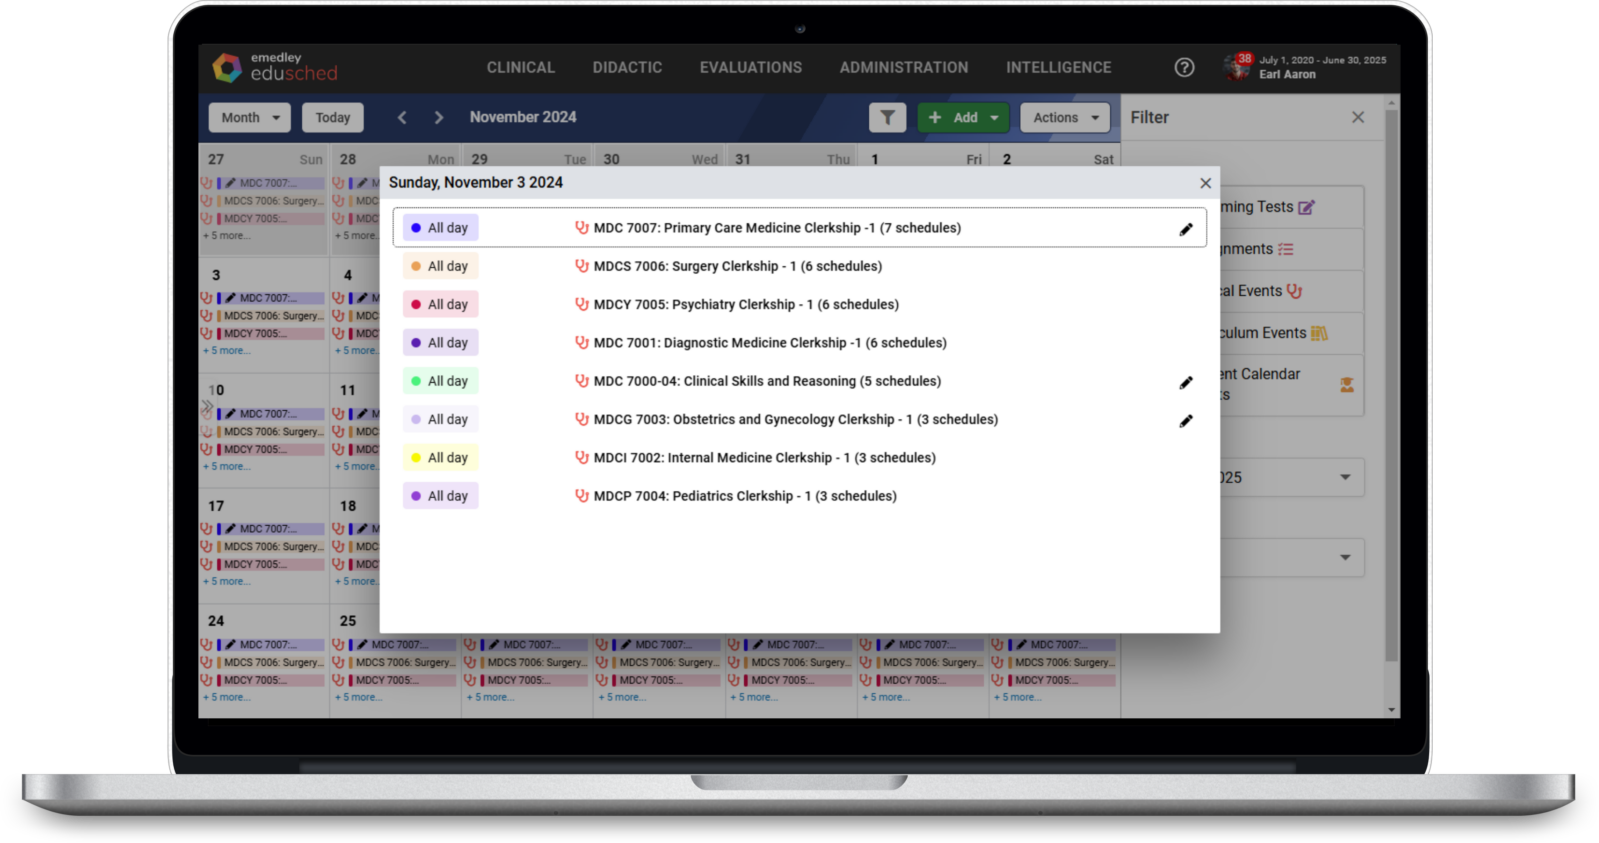
Visualize the number of scheduled rotations per month with a comprehensive calendar, providing a clear overview of the most frequently scheduled rotations and and when those rotations occur.
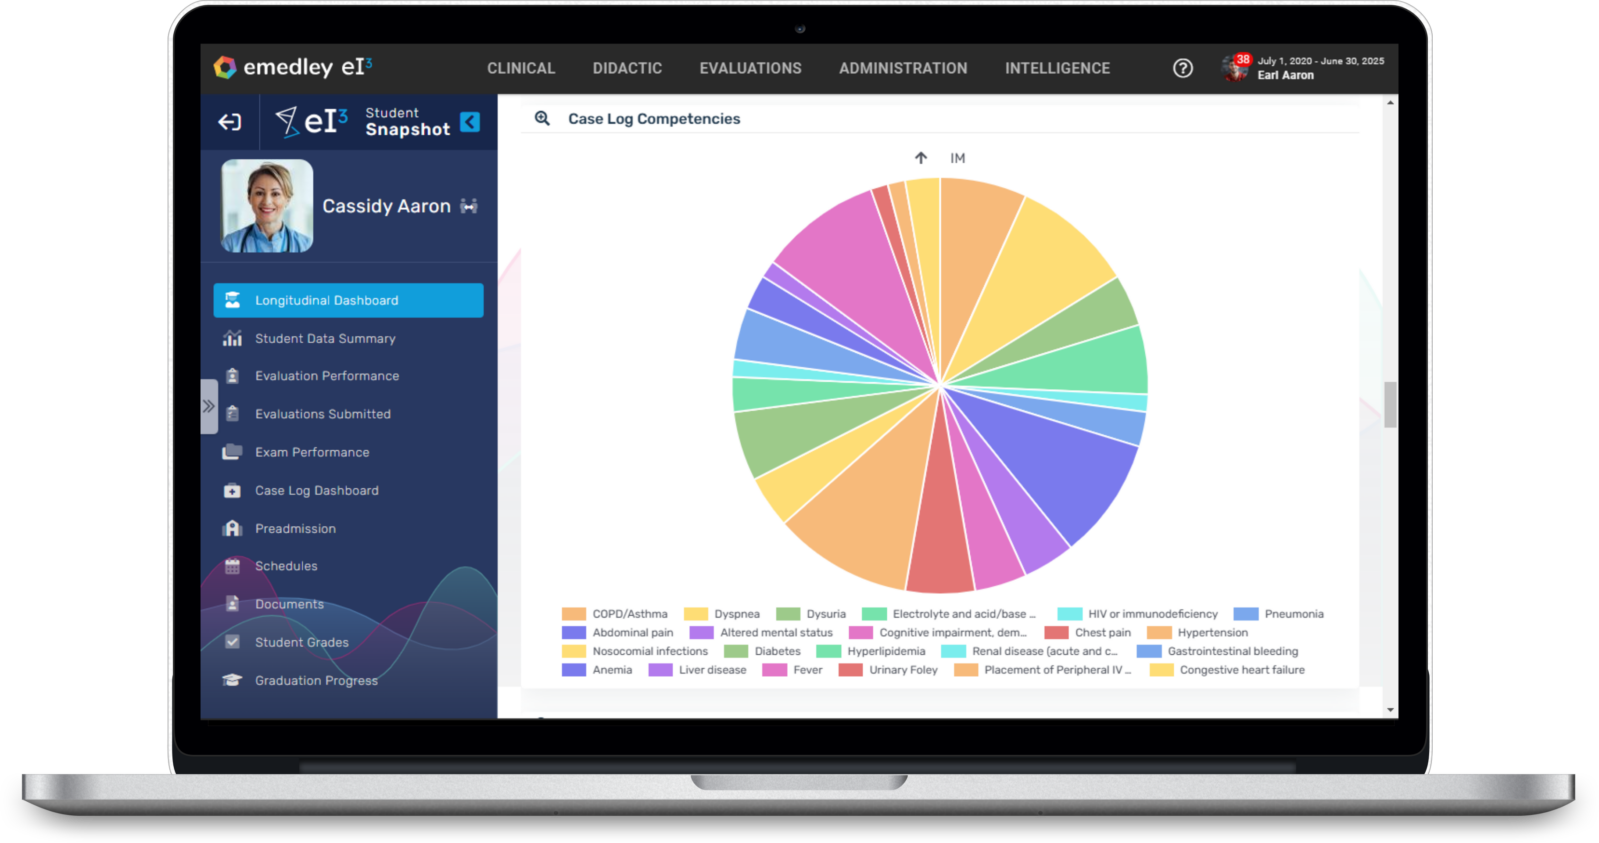
Access longitudinal student data, encompassing exam performance across courses, evaluation insights, program-specific outcomes, clinical competencies, advising interactions, academic concerns, and more.
Visualize

Easily analyze didactic and clinical course performance with interactive scatter plots. Access a detailed breakdown of student scores for each course, enabling quick identification of areas for improvement.

Visualize the number of scheduled rotations per month with a comprehensive calendar, providing a clear overview of the most frequently scheduled rotations and and when those rotations occur.

Access longitudinal student data, encompassing exam performance across courses, evaluation insights, program-specific outcomes, clinical competencies, advising interactions, academic concerns, and more.